Free to use
No fees, no hidden costs
Source-linked information
See details from official providers
Provider-direct links
Go straight to the provider
Price cap rates in every region
Ofgem's price cap for 1 October to 31 December 2026, Direct Debit and single-rate meters, ordered from the lowest to the highest typical yearly cost.
| Region | Electricity unit | Electricity standing | Gas unit | Gas standing | Typical yearly cost |
|---|---|---|---|---|---|
| 1.East Midlands | 25.36p | 51.45p/day | 7.82p | 29.41p/day | £1,672.04 |
| 2.North Western England | 26.49p | 45.68p/day | 7.86p | 29.81p/day | £1,684.49 |
| 3.London | 26.60p | 42.92p/day | 8.15p | 30.20p/day | £1,706.14 |
| 4.West Midlands | 25.60p | 57.23p/day | 7.90p | 29.71p/day | £1,707.83 |
| 5.Eastern England | 26.61p | 51.84p/day | 7.91p | 29.34p/day | £1,713.01 |
| 6.Northern Scotland | 26.35p | 55.14p/day | 7.87p | 29.87p/day | £1,716.69 |
| 7.Southern England | 26.47p | 47.81p/day | 8.17p | 29.16p/day | £1,718.84 |
| 8.North Eastern England | 25.46p | 61.58p/day | 7.92p | 29.79p/day | £1,722.40 |
| 9.Yorkshire | 25.60p | 61.67p/day | 7.90p | 29.77p/day | £1,724.26 |
| 10.Southern Scotland | 26.11p | 61.41p/day | 7.87p | 29.89p/day | £1,733.65 |
| 11.South Eastern England | 26.88p | 52.32p/day | 8.05p | 29.26p/day | £1,734.52 |
| 12.Southern Wales | 26.55p | 55.41p/day | 8.09p | 29.96p/day | £1,743.90 |
| 13.South Western England | 26.58p | 55.58p/day | 8.12p | 29.31p/day | £1,745.75 |
| 14.Merseyside and Northern Wales | 27.86p | 67.66p/day | 7.91p | 30.08p/day | £1,804.70 |
| Great Britain average | 26.32p | 54.83p/day | 7.97p | 29.68p/day | £1,723.61 |
Typical yearly cost uses Ofgem's medium usage of 2,500 kWh of electricity and 9,500 kWh of gas a year. Unit rates are per kWh and include VAT. Source: Ofgem price cap rates (opens in a new tab)
Choose your region
 East MidlandsTypical yearly cost £1,672.04See prices
 East of EnglandTypical yearly cost £1,713.01See prices
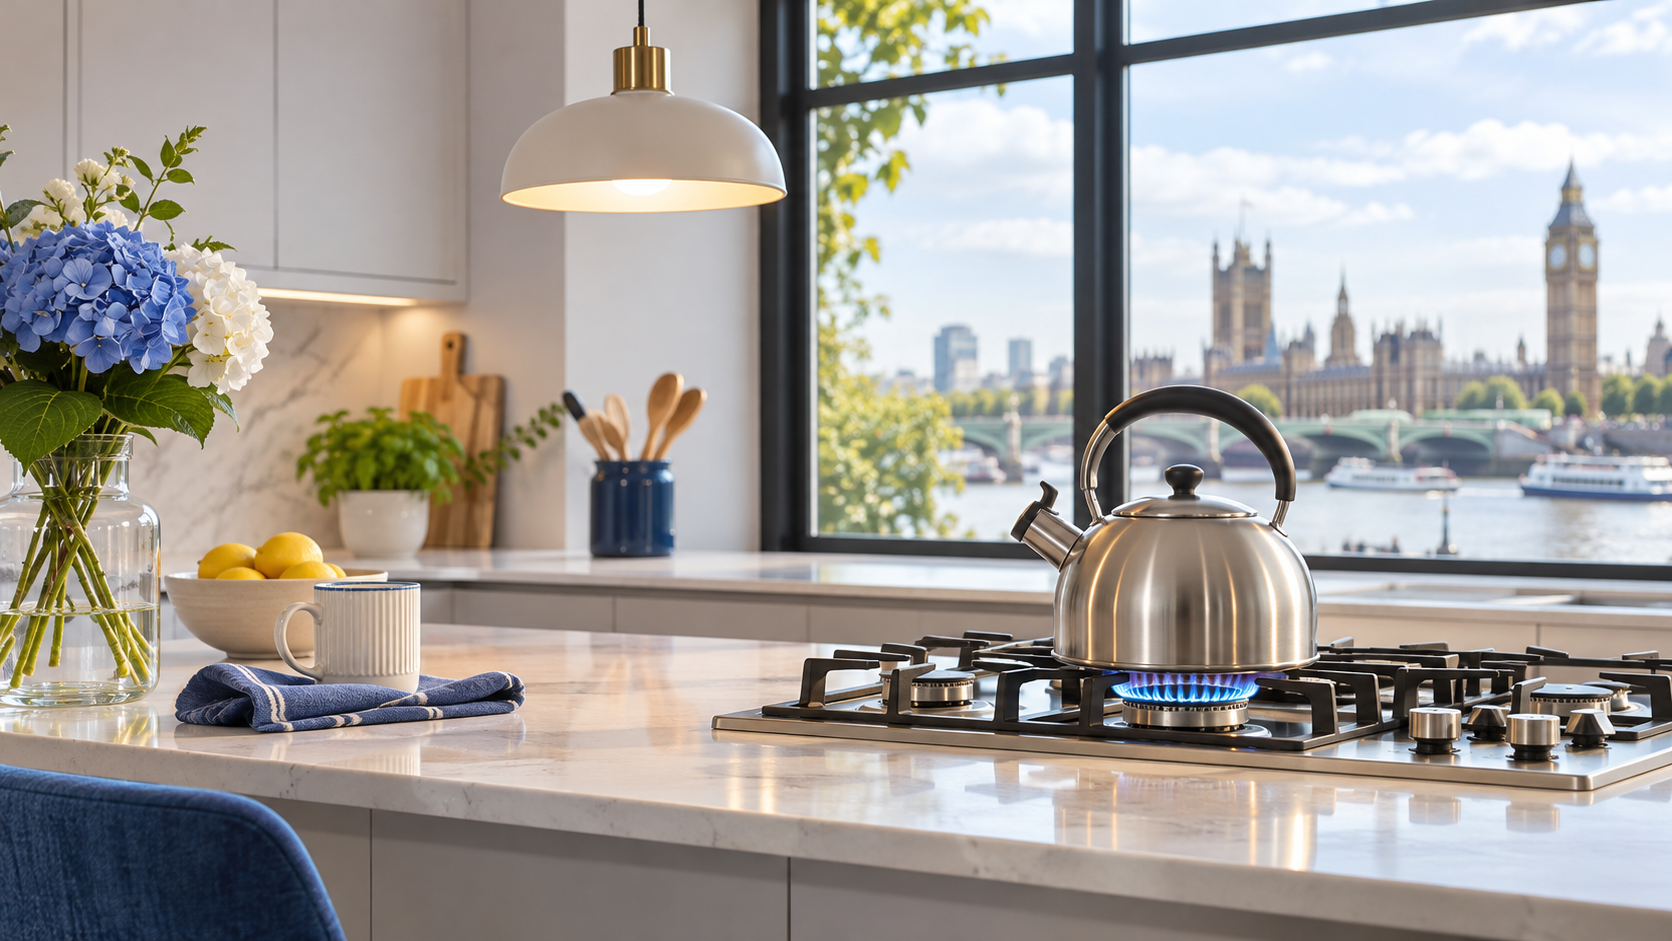 LondonTypical yearly cost £1,706.14See prices
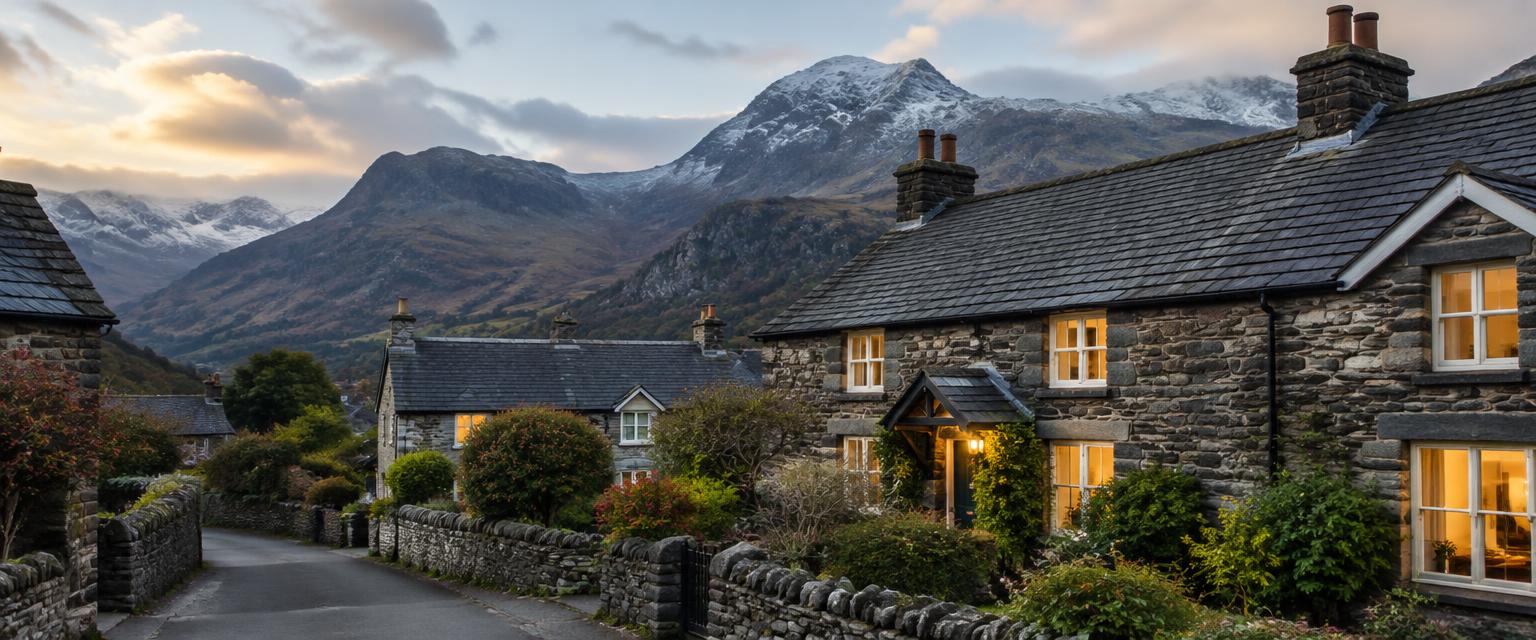 Merseyside and North WalesTypical yearly cost £1,804.70See prices
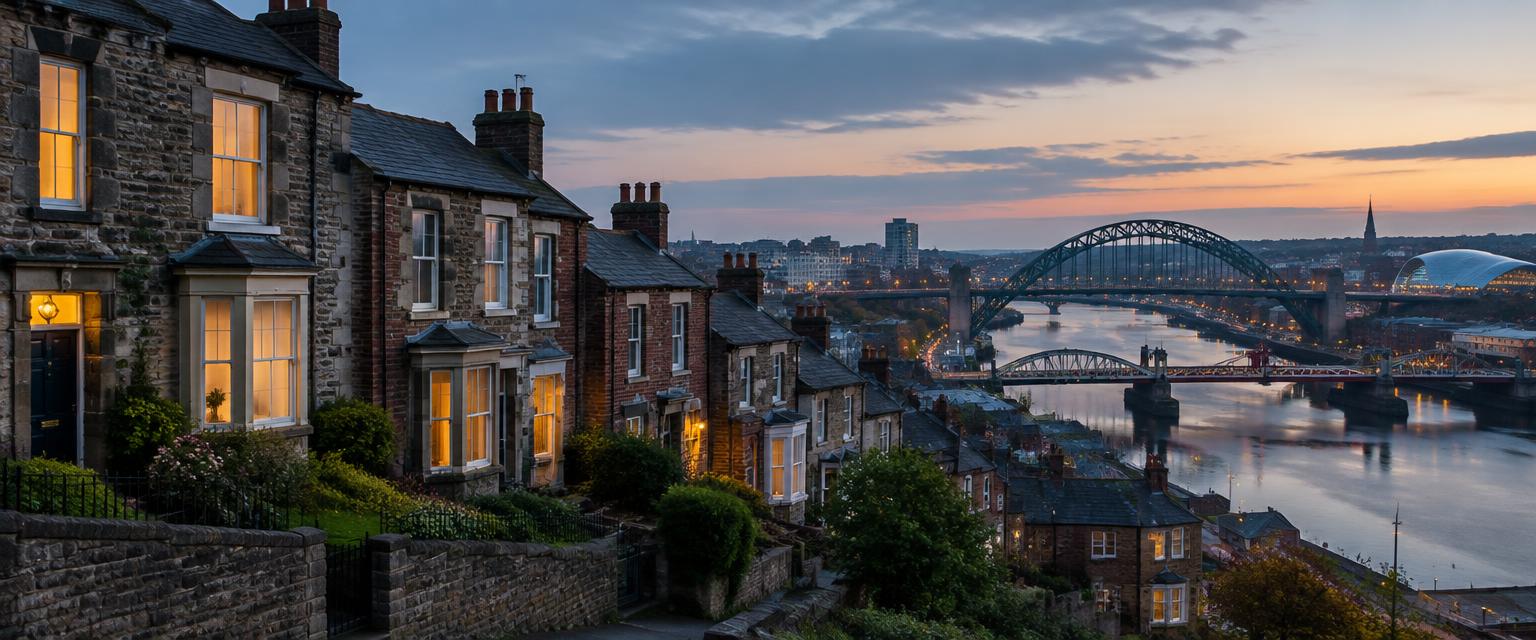 North East EnglandTypical yearly cost £1,722.40See prices
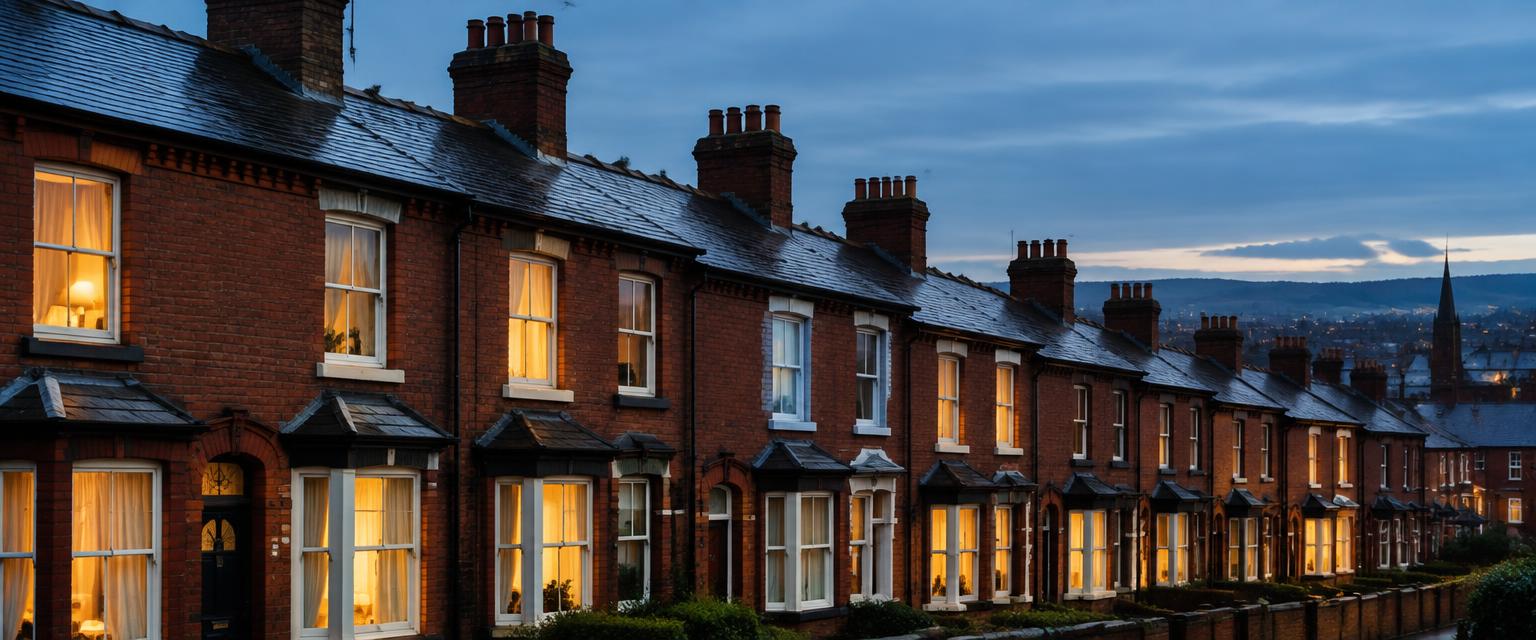 North West EnglandTypical yearly cost £1,684.49See prices
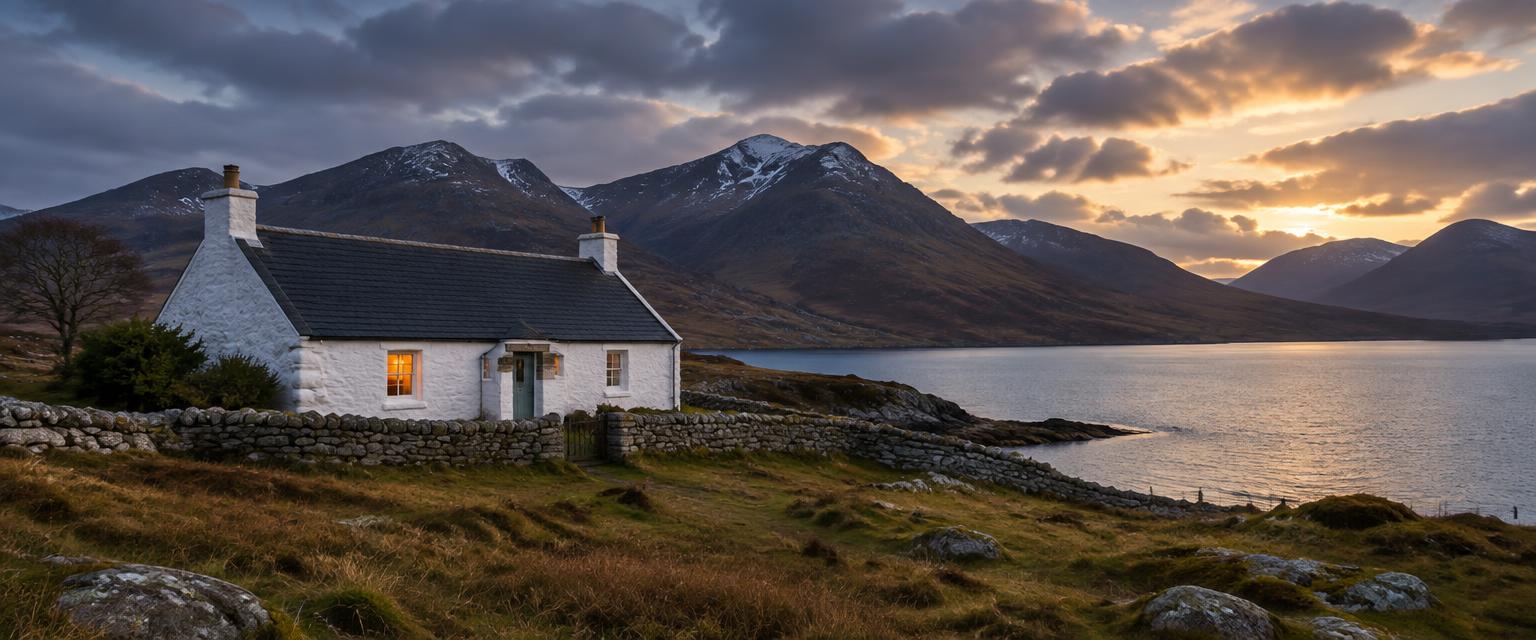 Northern ScotlandTypical yearly cost £1,716.69See prices
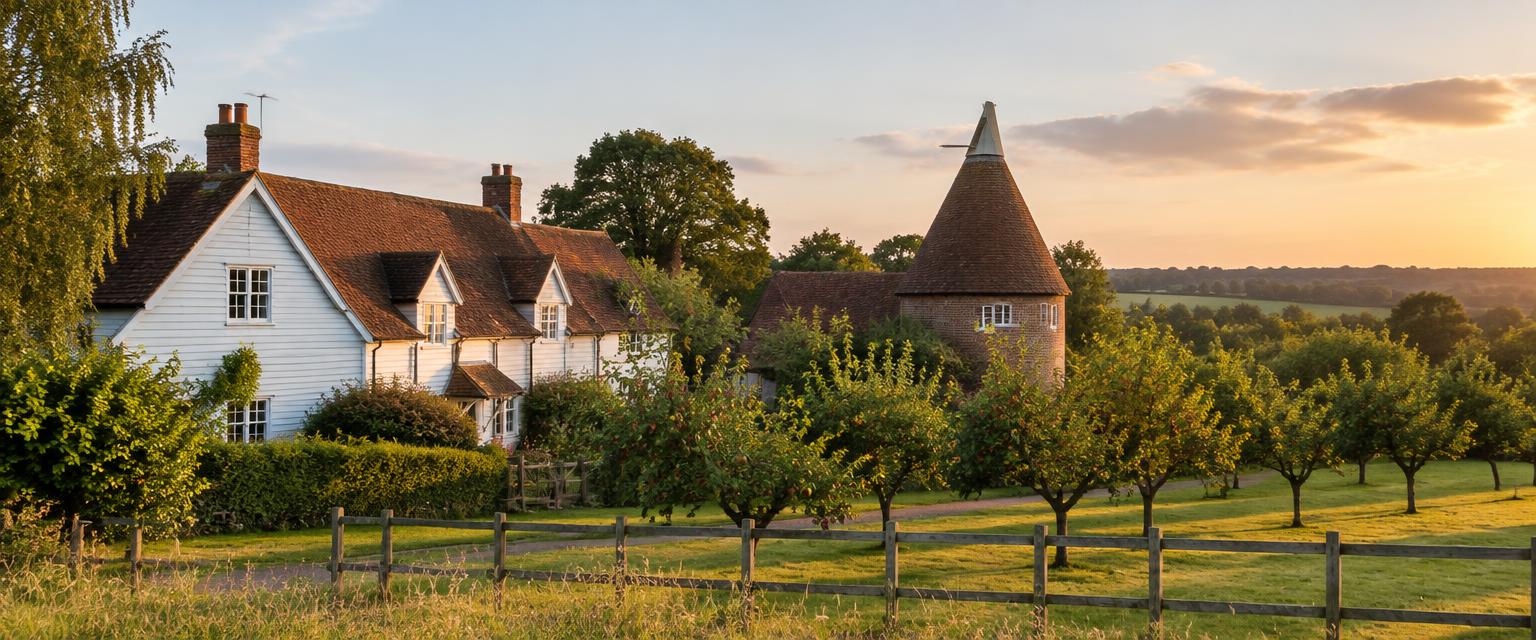 South East EnglandTypical yearly cost £1,734.52See prices
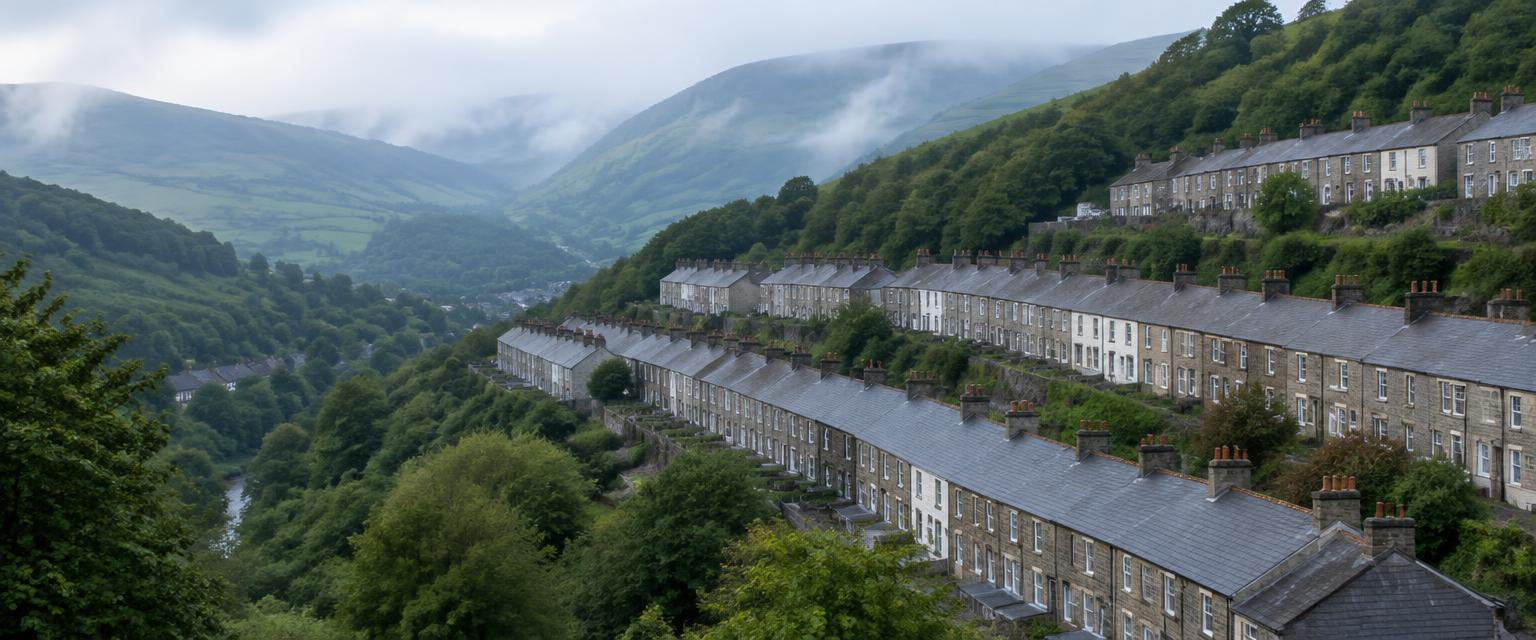 South WalesTypical yearly cost £1,743.90See prices
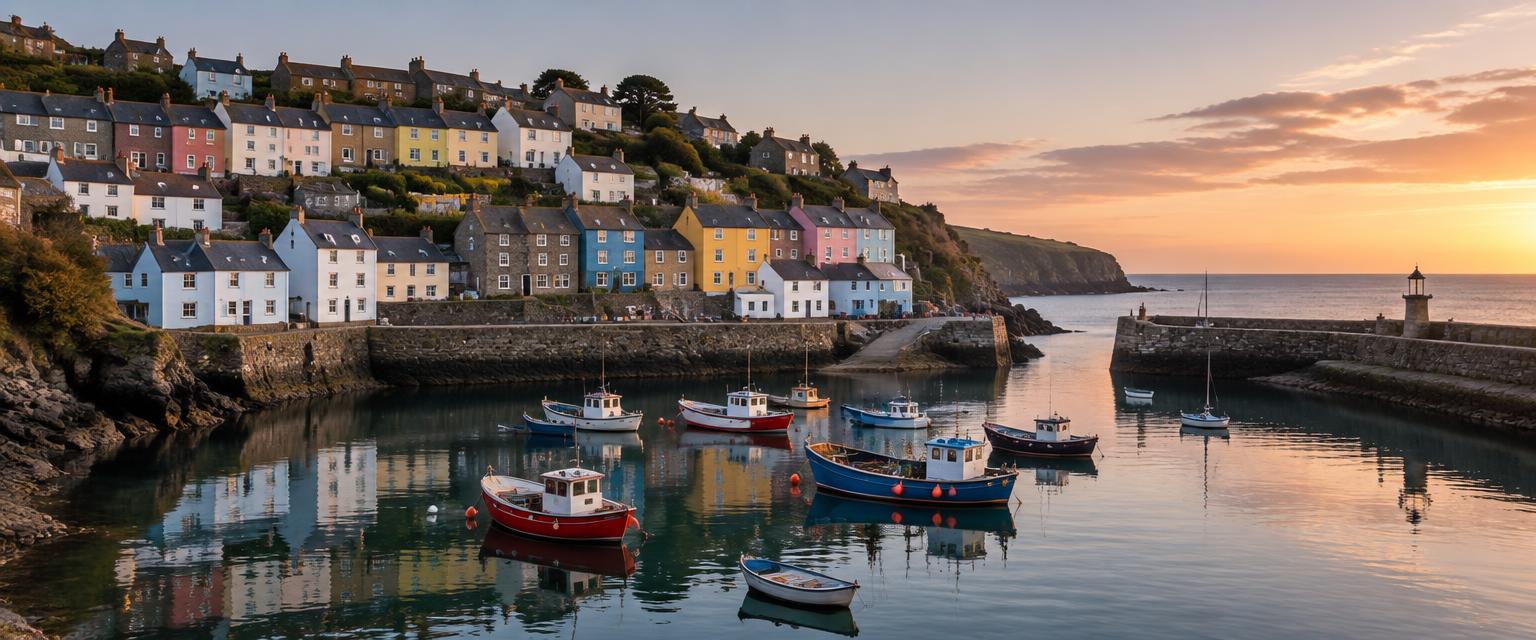 South West EnglandTypical yearly cost £1,745.75See prices
 Southern EnglandTypical yearly cost £1,718.84See prices
 Southern ScotlandTypical yearly cost £1,733.65See prices
 West MidlandsTypical yearly cost £1,707.83See prices
 YorkshireTypical yearly cost £1,724.26See prices
Why energy prices differ between regions
Great Britain is split into 14 electricity regions, each with its own network company. The cost of running those networks — and getting gas and electricity to homes — is different in each one, so Ofgem sets separate price cap rates per region.
The biggest gap is usually the daily standing charge, which you pay whatever you use. That means the region you live in matters more for small homes and low users, while unit rates matter more for homes that use a lot of energy.
How to find your region
Your region follows your local electricity network, not your council or postcode area, so homes near a boundary can be in a neighbouring region. Check your bill, or enter your postcode in the Energy Networks Association's network operator finder.
Frequently asked questions
Why do energy prices vary by region?
Mostly because the cost of running the local electricity and gas networks differs across Great Britain. Ofgem sets separate price cap rates for each of the 14 electricity regions, and the difference shows up mainly in the daily standing charge.
How do I find my energy region?
Your region is set by your local electricity network, not your council. Your bill usually names it, or you can enter your postcode in the Energy Networks Association's network operator finder.
Which region has the cheapest energy?
At the current price cap rates, East Midlands has the lowest typical yearly cost (£1,672.04) and Merseyside and Northern Wales the highest (£1,804.70), for a home using 2,500 kWh of electricity and 9,500 kWh of gas a year and paying by Direct Debit.
Is Northern Ireland included?
No. The Ofgem price cap covers England, Scotland and Wales only. Northern Ireland's energy market is regulated separately by the Utility Regulator.
Related energy pages
- Compare energy deals UK
- Compare gas tariffs
- Compare electricity tariffs
- Price cap calculator
- Fixed vs variable tariffs
- Switching energy
Price cap figures come from Ofgem and apply to default tariffs paid by Direct Debit on a single-rate meter. Supplier tariffs are dated snapshots of suppliers' own pages, last checked 9 November 2026, not live prices. Confirm rates and terms with the supplier before you switch. CompareDirect is not a credit broker and gives no financial advice.
Found this helpful? Share it with family and friends.
Know someone who might find this useful? Share it with them.